Saturday 24 December 2011

How to make 100% in 4 weeks whilst risking your house ...

On Friday afternoon Manila time, Watcher reached 100% over its November 21st starting balance. Market has been characterized by unverifiable news (rumour) causing it to briefly kick up, then to settle back down to its support level around 1.30. This is also a major psychological level. From here, there is up and there is the June 2010 level of around 1.20, then quickly down to September 2001 levels of 0.85. Scary! news of good Spanish bond sales bely the fact that Spain cannot repay its debts, there just simply isn't the margin in its budget. An interesting comparison of national debt per capita shows the US in a surprisingly strong position over the majority of European nations.


On another note, HSBC moots AUD falling to 0.93c from its current parity level, so that's another medium to long opportunity to watch out for.

Monday 19 December 2011

How to make 85% in 3 weeks whilst risking your house ...


EURUSD price action has been very predictable over the last week. I predicted the drop to 1.302 (roughly where it is at time of writing) on the 13th, and can now see the "faux" moves the market makes(paticularly in NY session) again and again.

Trading grid is easy, but it has one big drawback. If the trend goes against you, you will lose your shirt. I have added many features to Watcher to help prevent this, but the major change has been moving from a microtrend logic to trying to follow the "major" trend. Placing pending orders when the price is further from the grid point also helps to avoid them triggering soon after placement.Its that simple.

Over on StockTwits, I also receive some great insight and tips from other traders. Kudos to @JuanLobato for his recognition of the bearish EURUSD M1 triple top. Seems obvious in hindsight, but while others are looking to the esoteric, Juan was the only one to tweet this:


StockTwits is invaluable for determining "why did it do that" as news comes in a very timely fashion


Finally, an extract from the broker report last week. I show this to demonstrate the significant pattern of ratcheting Watcher has made since trading of this version began. Watcher is (at time of writing) at 85.76% profit since 12st November.


Happy holidays to all!

Sunday 11 December 2011

111211 - Week In Pictures

Watcher, my grid trading program, continues to survive the markets after 3 weeks of trading. The account now stands at $7560 (equity) showing a net profit of 51.2% since Nov 21st. Balance is at $8110, with open PL (usually negative given the nature of the app) at $(550). Free margin is at 1260%, with 150:1 leverage. The EA has complete control, closing all open positions when a certain percentage increase of equity has been achieved. Experience is showing that it is giving away some potential profit, as price continues in a favorable direction, but this is not always guaranteed, since the killer price action for grid trading is a low-volataility move away from the trend which the app is trying to follow.


From the fundamentals side, the short-only strategy for EURUSD has been a bit of a no-brainer. Global bank coordination to increase liquidity has had no effect on the pair, and this weeks meeting of European finance ministers failing to agree on anything that will solve the debt crisis in the short to medium term only serves to increase concerns regarding the future of the EURO.

There was a false breakout of the (slightly bearish) triangle of consolidation on the 9th which set the limits of the European session.

False Breakout

From the technical side, my studies of support and resistance around both price and volume see key turning pivots at the 1.345 and 1.328 point. I found the heat maps I was using last week to be a bit garish for day-to-day viewing, so have removed the colors and just marked the lines of significant change.


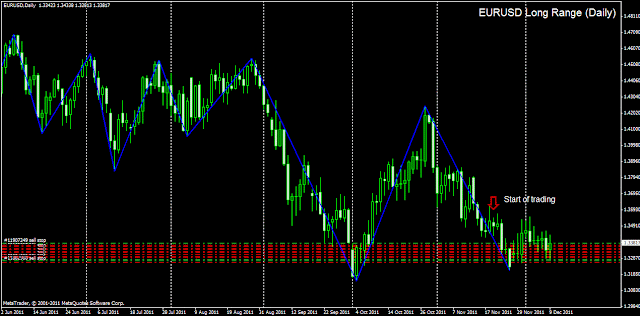
In order to monitor the trend, I use daily, weekly and monthly long-range charts:


Sunday 4 December 2011

111204 - The Week In Pictures

After being up 22% on the week last week with the new version of Watcher, it was only to be expected that this week would be less, possibly even finishing with account equity being lower, as we accumulate more losing positions.
 
On Wednesday central banks coordinated to reduce cost of liquidity swaps by 50 basis points. However, the
Euribor-OIS 3-month spread, the rate at which Euro-zone banks lend unsecured funds to one another, closed at its yearly high. "For context, the last time the Euribor-OIS 3-month spread was this elevated and in an uptrend was in September 2008, right after Lehman Brothers went under".

US Non-farm payroll numbers turned out slightly positive, but the end of the week dollar rally (at expense of the Euro) was probably due to long positions being closed prior to the weekend. Hardly surprising given the 100 pip gap at the week's open (though this was a positive gap). With the Euro debt situation worsening (though see here) it seems like the market doesn't know which way to go.


Watcher closed a significant number of trades both at mid-week and at the close, finishing up an additional 12% (now 34% for the 2 weeks). Drawdown towards the 500% margin level was experienced, but this level was not breached. At one point, only 7 trades were opened, down from the week maximum of 17. Losing positions are less than 10% of equity at the close.

Looking at the heatmap, this is showing a shift in zones to a higher level (1.345 to 1.354) from the previous zone (1.328 to 1.34), with price now resting at the top of the original zone, as per my Wednesday prediction on StockTwits.


The long term view as shown by weekly chart (support lines in Green, Resistance lines in Red) is still negative.