After using the Smooth RSI Inverse Fisher Transform Indicator for the last week or so, I noticed some odd behaviour. In particular, the turns were not what I would expect, being a little shallow and slow.
Looking back at the original article in the October 2010 edition of Technical Analysis of Stocks and Commodities magazine, I noticed references to two stock price series, CSX and Starwood Hotels. I quickly downloaded the Starwood Hotels 2005 data from Yahoo!, but results were inconclusive. The price series was not the same as the one shown in the magazine.
Looking back at the original article in the October 2010 edition of Technical Analysis of Stocks and Commodities magazine, I noticed references to two stock price series, CSX and Starwood Hotels. I quickly downloaded the Starwood Hotels 2005 data from Yahoo!, but results were inconclusive. The price series was not the same as the one shown in the magazine.
I noticed that the author's email was thoughtfully included at the end of the article, and so fired off a request to ask him to verify the source of the data. Imagine my surprise and delight when, within 24 hours, I not only received a polite response from Mr Vervoort, but he also attached a copy of the exact data file he had used for his article!
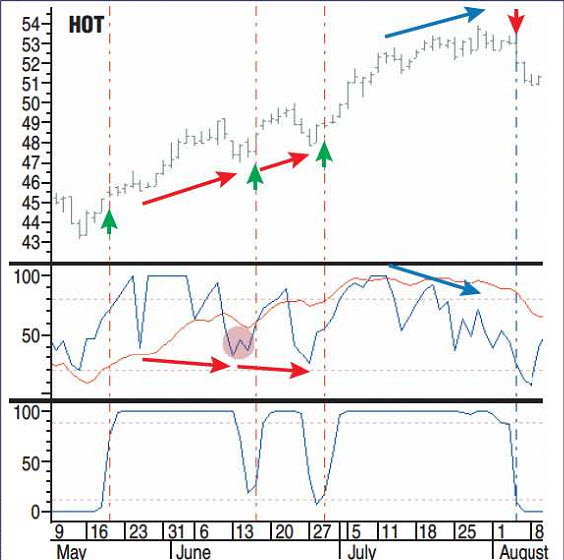
Plugging this into my Excel model quickly revealed a subtle bug. I then loaded the same data file into the MetaTrader history centre, and confirmed the exact same results Sylvain had presented in his article. This proved to me that a) you can't do enough testing, and b) there are some very nice obliging people in the industry. See below the figure from the original article, my Excel chart, and the corresponding MetaTrader chart.
Plugging this into my Excel model quickly revealed a subtle bug. I then loaded the same data file into the MetaTrader history centre, and confirmed the exact same results Sylvain had presented in his article. This proved to me that a) you can't do enough testing, and b) there are some very nice obliging people in the industry. See below the figure from the original article, my Excel chart, and the corresponding MetaTrader chart.
The figure from the original article

Sylvain's data file applied to my Excel model

The final result on the MetaTrader chart


No comments:
Post a Comment
Note: only a member of this blog may post a comment.