A nice relaxing weeks holiday, now back to work .....
I've been researching some new methods. Whilst Watcher provides many points of interest, grid trading is a bit like watching paint dry! Luckily, my fantastic customers keep supplying me with new areas of interest, and some of the spin-offs from this (outside of what they have paid me for, of course!) keep me going in more ways than one. I have the utmost admiration for those folks who have been in the same job for many years, I often think it's a matter of making the job interesting each day.
I am a big fan of ZigZag, but very conscious of the fact that this indicator (like almost all other indicators) can only tell you were the price has been. ZigZag needs to experience a user-definable point change before it can consider whether price has Zigged or Zagged. I was unaware (shame on me) until recently that the Fractal indicator supplied with MT4, and I guess widely used, is repainting. In my defense, m'lud, I have never used this indicator myself, so probably would never have known. It's particularly surprising then, given the highly simple nature of fractals, that any such indicator should repaint. So basing a trade entry on Fractals.ex4 would either get you in on the trade early (the attraction) or get you in early on a false signal.
Lets define what I mean by a fractal. In this context, a fractal is a low or high point, generally indicated by a bar with 2 higher or lower candles on each side. So a down (support) fractal is a low bar, with two higher lows on each side. An up (resistance) fractal, is a high bar, with two lower highs on each side. Terminology may differ depending on the author. These are a useful indication of turning points, and also handy indications of where to place stops.
An additional use for me is to identify gross trend. Funnily enough, Watcher is counter-trend, but that's another story! So I have reviewed this weeks chart using a non-repainting fractal histogram indicator, comparing that with the Smoothed RSI Inverse Fisher Transform indicator. I assess each chart's suitability for range (grid) trading or trend (swing) trading. My manual analysis is now nicely reduced to assessing whether the fractal histogram is "stepping" up or down in nice even chunks, or not. Easy, no?
 |
| AUDCAD showing some nice steps in midweek, ranging elsewhere |
 |
| AUDCHF Mainly ranging |
 |
| Lovely mid-week stepping action from AUDJPY |
 |
| AUDUSD again stepping in mid-week, is there a pattern here? |
 |
| Remember we are looking for a number of clear steps, absent in CADCHF |
 |
| CADJPY showing nice mid-week profit opportunities |
 |
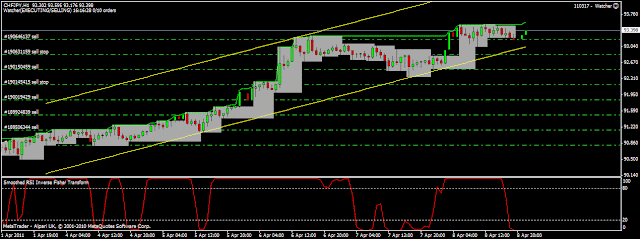
| CHFJPY stepping nicely for almost the first half of the week |
 |
| EURCHF ranging, with very "blocky" fractals on the histogram |
 |
| EURGBP showing 2 periods of stepping following a range at the start of the week |
 |
| GBPCHF largely ranging, a staple gridding pair |
 |
| 2 very nice selling opportunities seen here in USDCAD |
 |
| Choppy USDCHF with some late week stepping |
 |
| USDJPY showing some early to mid-week stepping |
In summary, I can see this becoming a complimentary strategy to Watcher, which tends not to accrue during such price action. Switching watcher off early is an option, but the idea in gridding is to accrue profit to overcome the drawdown suffered when a significant trend emerges.

No comments:
Post a Comment
Note: only a member of this blog may post a comment.