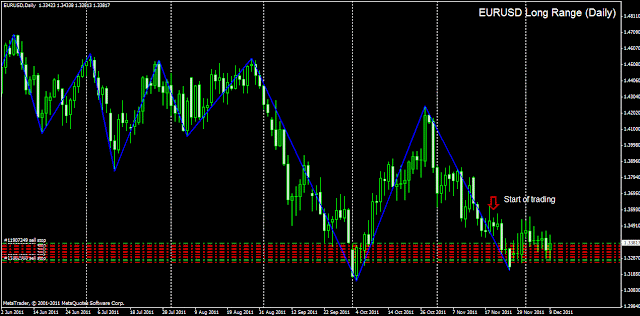
Watcher, my grid trading program, continues to survive the markets after 3 weeks of trading. The account now stands at $7560 (equity) showing a net profit of 51.2% since Nov 21st. Balance is at $8110, with open PL (usually negative given the nature of the app) at $(550). Free margin is at 1260%, with 150:1 leverage. The EA has complete control, closing all open positions when a certain percentage increase of equity has been achieved. Experience is showing that it is giving away some potential profit, as price continues in a favorable direction, but this is not always guaranteed, since the killer price action for grid trading is a low-volataility move away from the trend which the app is trying to follow.
From the fundamentals side, the short-only strategy for EURUSD has been a bit of a no-brainer. Global bank coordination to increase liquidity has had no effect on the pair, and this weeks meeting of European finance ministers failing to agree on anything that will solve the debt crisis in the short to medium term only serves to increase concerns regarding the future of the EURO.
There was a false breakout of the (slightly bearish) triangle of consolidation on the 9th which set the limits of the European session.
There was a false breakout of the (slightly bearish) triangle of consolidation on the 9th which set the limits of the European session.
 |
| False Breakout |
From the technical side, my studies of support and resistance around both price and volume see key turning pivots at the 1.345 and 1.328 point. I found the heat maps I was using last week to be a bit garish for day-to-day viewing, so have removed the colors and just marked the lines of significant change.
In order to monitor the trend, I use daily, weekly and monthly long-range charts:


No comments:
Post a Comment
Note: only a member of this blog may post a comment.