Showing posts with label GRID. Show all posts

Sunday, 15 January 2012

120115 - Watcher Update


At the risk of having a margin call that will completely ruin my mood, I have decided to post here my latest Watcher version results.

Watcher is my grid trading robot, built on the Metatrader4 platform. For the last 2 weeks, I have been trading it live with results that match the back-testing.

As of Friday afternoon Watcher is up +42%, and I am out of the market totally until Tuesday morning, or possibly NY session on Monday if I get back early enough from my current trip. The reason for taking a break is uncertain market direction from here. Futures open interest shows large speculators very short, the usual signal that precedes a rally. 

On a side note, my DR backup server is having some problems. I am using TeamViewer7 to control it remotely, and have some issues with logging in after reboots. This trip to deepest, darkest Quezon province has provided an excellent opportunity for me to shake this out.

I have been doing a LOT of reading this weekend, and have some great ideas on how to formulate a method for evaluating grid trading systems. This will allow me to perform significantly quicker testing for any new features. I am very keen on spreadsheet modelling, and this method will allow me to evaluate new techniques before coding.

My live experience is matching exactly with the forecast, though I am only shooting for 50% of forecast. Alpha-adding moves have added about 20% to the PL. On friday, when the fall started, I moved from a 20 pip to a 10 pip grid, and doubled my take profit to 20 pips. Then I just watched it fall.When I was down to the final 2 open trades, I switched Watcher off. As the price reached the trough, my last trade closed, and I was out of the market with +42% for the 2 weeks.

Now I am sure there are bruises to come, but manipulating the parameters on this version is way better than last time i tried this, so I will move to automating the main parameters, possibly running them from global variables again, rather than risk going through the EA inputs and screwing it up. Another thing I have done is to have a script to modify all existing TPs, so I can increase them independently of the EA.

I need also to do some tweaking on the prices at which I place pending orders, making them exact multiples of the grid width, and so avoiding the few situations where I end up with a couple of trades a few pips apart, which is inefficient.

Saturday, 24 December 2011

How to make 100% in 4 weeks whilst risking your house ...

On Friday afternoon Manila time, Watcher reached 100% over its November 21st starting balance. Market has been characterized by unverifiable news (rumour) causing it to briefly kick up, then to settle back down to its support level around 1.30. This is also a major psychological level. From here, there is up and there is the June 2010 level of around 1.20, then quickly down to September 2001 levels of 0.85. Scary! news of good Spanish bond sales bely the fact that Spain cannot repay its debts, there just simply isn't the margin in its budget. An interesting comparison of national debt per capita shows the US in a surprisingly strong position over the majority of European nations.


On another note, HSBC moots AUD falling to 0.93c from its current parity level, so that's another medium to long opportunity to watch out for.

Monday, 19 December 2011

How to make 85% in 3 weeks whilst risking your house ...


EURUSD price action has been very predictable over the last week. I predicted the drop to 1.302 (roughly where it is at time of writing) on the 13th, and can now see the "faux" moves the market makes(paticularly in NY session) again and again.

Trading grid is easy, but it has one big drawback. If the trend goes against you, you will lose your shirt. I have added many features to Watcher to help prevent this, but the major change has been moving from a microtrend logic to trying to follow the "major" trend. Placing pending orders when the price is further from the grid point also helps to avoid them triggering soon after placement.Its that simple.

Over on StockTwits, I also receive some great insight and tips from other traders. Kudos to @JuanLobato for his recognition of the bearish EURUSD M1 triple top. Seems obvious in hindsight, but while others are looking to the esoteric, Juan was the only one to tweet this:


StockTwits is invaluable for determining "why did it do that" as news comes in a very timely fashion


Finally, an extract from the broker report last week. I show this to demonstrate the significant pattern of ratcheting Watcher has made since trading of this version began. Watcher is (at time of writing) at 85.76% profit since 12st November.


Happy holidays to all!

Sunday, 11 December 2011

111211 - Week In Pictures

Watcher, my grid trading program, continues to survive the markets after 3 weeks of trading. The account now stands at $7560 (equity) showing a net profit of 51.2% since Nov 21st. Balance is at $8110, with open PL (usually negative given the nature of the app) at $(550). Free margin is at 1260%, with 150:1 leverage. The EA has complete control, closing all open positions when a certain percentage increase of equity has been achieved. Experience is showing that it is giving away some potential profit, as price continues in a favorable direction, but this is not always guaranteed, since the killer price action for grid trading is a low-volataility move away from the trend which the app is trying to follow.


From the fundamentals side, the short-only strategy for EURUSD has been a bit of a no-brainer. Global bank coordination to increase liquidity has had no effect on the pair, and this weeks meeting of European finance ministers failing to agree on anything that will solve the debt crisis in the short to medium term only serves to increase concerns regarding the future of the EURO.

There was a false breakout of the (slightly bearish) triangle of consolidation on the 9th which set the limits of the European session.

False Breakout

From the technical side, my studies of support and resistance around both price and volume see key turning pivots at the 1.345 and 1.328 point. I found the heat maps I was using last week to be a bit garish for day-to-day viewing, so have removed the colors and just marked the lines of significant change.


In order to monitor the trend, I use daily, weekly and monthly long-range charts:


Sunday, 4 December 2011

111204 - The Week In Pictures

After being up 22% on the week last week with the new version of Watcher, it was only to be expected that this week would be less, possibly even finishing with account equity being lower, as we accumulate more losing positions.
 
On Wednesday central banks coordinated to reduce cost of liquidity swaps by 50 basis points. However, the
Euribor-OIS 3-month spread, the rate at which Euro-zone banks lend unsecured funds to one another, closed at its yearly high. "For context, the last time the Euribor-OIS 3-month spread was this elevated and in an uptrend was in September 2008, right after Lehman Brothers went under".

US Non-farm payroll numbers turned out slightly positive, but the end of the week dollar rally (at expense of the Euro) was probably due to long positions being closed prior to the weekend. Hardly surprising given the 100 pip gap at the week's open (though this was a positive gap). With the Euro debt situation worsening (though see here) it seems like the market doesn't know which way to go.


Watcher closed a significant number of trades both at mid-week and at the close, finishing up an additional 12% (now 34% for the 2 weeks). Drawdown towards the 500% margin level was experienced, but this level was not breached. At one point, only 7 trades were opened, down from the week maximum of 17. Losing positions are less than 10% of equity at the close.

Looking at the heatmap, this is showing a shift in zones to a higher level (1.345 to 1.354) from the previous zone (1.328 to 1.34), with price now resting at the top of the original zone, as per my Wednesday prediction on StockTwits.


The long term view as shown by weekly chart (support lines in Green, Resistance lines in Red) is still negative.

Saturday, 9 April 2011

110409 - The Week In Pictures

A nice relaxing weeks holiday, now back to work .....

I've been researching some new methods. Whilst Watcher provides many points of interest, grid trading is a bit like watching paint dry! Luckily, my fantastic customers keep supplying me with new areas of interest, and some of the spin-offs from this (outside of what they have paid me for, of course!) keep me going in more ways than one. I have the utmost admiration for those folks who have been in the same job for many years, I often think it's a matter of making the job interesting each day.

I am a big fan of ZigZag, but very conscious of the fact that this indicator (like almost all other indicators) can only tell you were the price has been. ZigZag needs to experience a user-definable point change before it can consider whether price has Zigged or Zagged. I was unaware (shame on me) until recently that the Fractal indicator supplied with MT4, and I guess widely used, is repainting. In my defense, m'lud, I have never used this indicator myself, so probably would never have known. It's particularly surprising then, given the highly simple nature of fractals, that any such indicator should repaint. So basing a trade entry on Fractals.ex4 would either get you in on the trade early (the attraction) or get you in early on a false signal.

Lets define what I mean by a fractal. In this context, a fractal is a low or high point, generally indicated by a bar with 2 higher or lower candles on each side. So a down (support) fractal is a low bar, with two higher lows on each side. An up (resistance) fractal, is a high bar, with two lower highs on each side. Terminology may differ depending on the author. These are a useful indication of turning points, and also handy indications of where to place stops.

An additional use for me is to identify gross trend. Funnily enough, Watcher is counter-trend, but that's another story! So I have reviewed this weeks chart using a non-repainting fractal histogram indicator, comparing that with the Smoothed RSI Inverse Fisher Transform indicator. I assess each chart's suitability for range (grid) trading or trend (swing) trading. My manual analysis is now nicely reduced to assessing whether the fractal histogram is "stepping" up or down in nice even chunks, or not. Easy, no?

AUDCAD showing some nice steps in midweek, ranging elsewhere

AUDCHF Mainly ranging

Lovely mid-week stepping action from AUDJPY

AUDUSD again stepping in mid-week, is there a pattern here?

Remember we are looking for a number of clear steps, absent in CADCHF

CADJPY showing nice mid-week profit opportunities

CHFJPY stepping nicely for almost the first half of the week

EURCHF ranging, with very "blocky" fractals on the histogram

EURGBP showing 2 periods of stepping following a range at the start of the week

GBPCHF largely ranging, a staple gridding pair

2 very nice selling opportunities seen here in USDCAD

Choppy USDCHF with some late week stepping

USDJPY showing some early to mid-week stepping

In summary, I can see this becoming a complimentary strategy to Watcher, which tends not to accrue during such price action. Switching watcher off early is an option, but the idea in gridding is to accrue profit to overcome the drawdown suffered when a significant trend emerges.

Saturday, 26 March 2011

110326 - The Week In Pictures

Main observations this week have been the continuing uptrend of AUD, plus a little bit of volatility and uptrend in JPY at the end of the week. This is the most JPY has moved since the Sendai earthquake (has it already been a week?). As far as Watcher goes, now is the time to start monitoring JPY pairs more closely so we don't get any runaway trending. Circuit breakers are in place to limit losses if I happen to be asleep at the time! As for AUD, Watcher is not configured to sell AUD because of the negative swap implications, so looks like all 4 pairs that are set up will be dormant for a while. Once a limit is reached, however, I may consider switching sells back on (and I maybe will get burnt!).

Lots of TP lines evident this week. Its time for yours truly to take a break for a week. Whenever I move location, I turn off cloaking as a precaution. Once back in location, on it goes again.

AUDCAD

AUDCHF

AUDJPY
AUDUSD

The AUD family trending nicely, swing and SRIFT indicator showing lots of intra-day opportunities.

CADCHF
CADCHF reverting to nDay mid-point.

CADJPY
 CADJPY showing possible topping out, both Swing and SRIFT confirm trend move down.

CHFJPY
CHFJPY reverting to nDay mid-point.

EURCHF
EURCHF showing strong uptrend. Need to watch this one more closely.

EURGBP
EURGBP moving to new level range.

GBPCHF
GBPCHF showing some excellent ranging.

USDCAD
USDCAD showing some late bullish activity, but CAD remains strong.

USDCHF
USDCHF showing increasing trend with 5 day and 3 day regression channels. Excellent intra-day from swing and SRIFT.

USDJPY

Saturday, 19 March 2011

110319 - The Week In Pictures

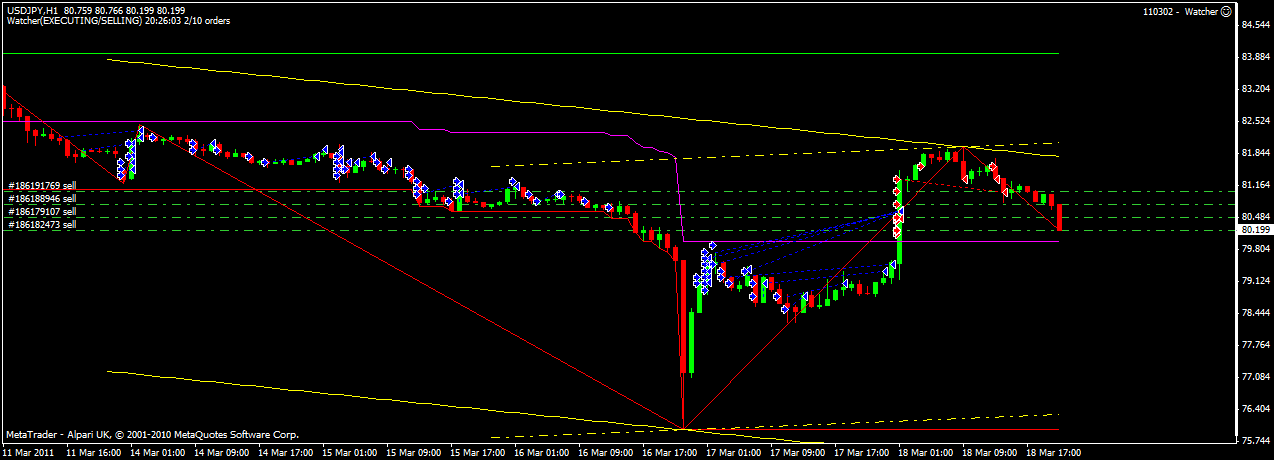
No prizes for guessing the theme of this weeks round-up. Harmonic enthusiasts may even invent new names for the .... (is it a rat/crocodile/peacock/dragon?) pattern which was the result of the frantic buying of yen last week. Luckily, the Watcher circuit breaker prevented a potential disaster, and also allowed a massive US$3K recovery the following few hours. The only other point of interest to me was those pairs that I trade that were NOT correlated (or were inversely correlated) with USDJPY:


Seems the event passed EURGBP right on by ...


USDCAD was inversely correlated.