Showing posts with label SOFTWARE. Show all posts

Sunday, 15 January 2012

120115 - Watcher Update


At the risk of having a margin call that will completely ruin my mood, I have decided to post here my latest Watcher version results.

Watcher is my grid trading robot, built on the Metatrader4 platform. For the last 2 weeks, I have been trading it live with results that match the back-testing.

As of Friday afternoon Watcher is up +42%, and I am out of the market totally until Tuesday morning, or possibly NY session on Monday if I get back early enough from my current trip. The reason for taking a break is uncertain market direction from here. Futures open interest shows large speculators very short, the usual signal that precedes a rally. 

On a side note, my DR backup server is having some problems. I am using TeamViewer7 to control it remotely, and have some issues with logging in after reboots. This trip to deepest, darkest Quezon province has provided an excellent opportunity for me to shake this out.

I have been doing a LOT of reading this weekend, and have some great ideas on how to formulate a method for evaluating grid trading systems. This will allow me to perform significantly quicker testing for any new features. I am very keen on spreadsheet modelling, and this method will allow me to evaluate new techniques before coding.

My live experience is matching exactly with the forecast, though I am only shooting for 50% of forecast. Alpha-adding moves have added about 20% to the PL. On friday, when the fall started, I moved from a 20 pip to a 10 pip grid, and doubled my take profit to 20 pips. Then I just watched it fall.When I was down to the final 2 open trades, I switched Watcher off. As the price reached the trough, my last trade closed, and I was out of the market with +42% for the 2 weeks.

Now I am sure there are bruises to come, but manipulating the parameters on this version is way better than last time i tried this, so I will move to automating the main parameters, possibly running them from global variables again, rather than risk going through the EA inputs and screwing it up. Another thing I have done is to have a script to modify all existing TPs, so I can increase them independently of the EA.

I need also to do some tweaking on the prices at which I place pending orders, making them exact multiples of the grid width, and so avoiding the few situations where I end up with a couple of trades a few pips apart, which is inefficient.

Sunday, 1 January 2012

Kaufman Adaptive Moving Average Binary Wave

This new addition to the products line gives fast switching to easily detect trading opportunities. For more details on the algorithm, see Perry Kaufman's Smarter Trading - Improving Performance in Changing markets.

In addition to the binary signal line (solid), the indicator also shows the trend efficiency ratio, a measure of the noisiness of the price series. Close to zero is noisy, close to 1 is trending.


Saturday, 24 December 2011

How to make 100% in 4 weeks whilst risking your house ...

On Friday afternoon Manila time, Watcher reached 100% over its November 21st starting balance. Market has been characterized by unverifiable news (rumour) causing it to briefly kick up, then to settle back down to its support level around 1.30. This is also a major psychological level. From here, there is up and there is the June 2010 level of around 1.20, then quickly down to September 2001 levels of 0.85. Scary! news of good Spanish bond sales bely the fact that Spain cannot repay its debts, there just simply isn't the margin in its budget. An interesting comparison of national debt per capita shows the US in a surprisingly strong position over the majority of European nations.


On another note, HSBC moots AUD falling to 0.93c from its current parity level, so that's another medium to long opportunity to watch out for.

Monday, 19 December 2011

How to make 85% in 3 weeks whilst risking your house ...


EURUSD price action has been very predictable over the last week. I predicted the drop to 1.302 (roughly where it is at time of writing) on the 13th, and can now see the "faux" moves the market makes(paticularly in NY session) again and again.

Trading grid is easy, but it has one big drawback. If the trend goes against you, you will lose your shirt. I have added many features to Watcher to help prevent this, but the major change has been moving from a microtrend logic to trying to follow the "major" trend. Placing pending orders when the price is further from the grid point also helps to avoid them triggering soon after placement.Its that simple.

Over on StockTwits, I also receive some great insight and tips from other traders. Kudos to @JuanLobato for his recognition of the bearish EURUSD M1 triple top. Seems obvious in hindsight, but while others are looking to the esoteric, Juan was the only one to tweet this:


StockTwits is invaluable for determining "why did it do that" as news comes in a very timely fashion


Finally, an extract from the broker report last week. I show this to demonstrate the significant pattern of ratcheting Watcher has made since trading of this version began. Watcher is (at time of writing) at 85.76% profit since 12st November.


Happy holidays to all!

Sunday, 11 December 2011

111211 - Week In Pictures

Watcher, my grid trading program, continues to survive the markets after 3 weeks of trading. The account now stands at $7560 (equity) showing a net profit of 51.2% since Nov 21st. Balance is at $8110, with open PL (usually negative given the nature of the app) at $(550). Free margin is at 1260%, with 150:1 leverage. The EA has complete control, closing all open positions when a certain percentage increase of equity has been achieved. Experience is showing that it is giving away some potential profit, as price continues in a favorable direction, but this is not always guaranteed, since the killer price action for grid trading is a low-volataility move away from the trend which the app is trying to follow.


From the fundamentals side, the short-only strategy for EURUSD has been a bit of a no-brainer. Global bank coordination to increase liquidity has had no effect on the pair, and this weeks meeting of European finance ministers failing to agree on anything that will solve the debt crisis in the short to medium term only serves to increase concerns regarding the future of the EURO.

There was a false breakout of the (slightly bearish) triangle of consolidation on the 9th which set the limits of the European session.

False Breakout

From the technical side, my studies of support and resistance around both price and volume see key turning pivots at the 1.345 and 1.328 point. I found the heat maps I was using last week to be a bit garish for day-to-day viewing, so have removed the colors and just marked the lines of significant change.


In order to monitor the trend, I use daily, weekly and monthly long-range charts:


Sunday, 4 December 2011

111204 - The Week In Pictures

After being up 22% on the week last week with the new version of Watcher, it was only to be expected that this week would be less, possibly even finishing with account equity being lower, as we accumulate more losing positions.
 
On Wednesday central banks coordinated to reduce cost of liquidity swaps by 50 basis points. However, the
Euribor-OIS 3-month spread, the rate at which Euro-zone banks lend unsecured funds to one another, closed at its yearly high. "For context, the last time the Euribor-OIS 3-month spread was this elevated and in an uptrend was in September 2008, right after Lehman Brothers went under".

US Non-farm payroll numbers turned out slightly positive, but the end of the week dollar rally (at expense of the Euro) was probably due to long positions being closed prior to the weekend. Hardly surprising given the 100 pip gap at the week's open (though this was a positive gap). With the Euro debt situation worsening (though see here) it seems like the market doesn't know which way to go.


Watcher closed a significant number of trades both at mid-week and at the close, finishing up an additional 12% (now 34% for the 2 weeks). Drawdown towards the 500% margin level was experienced, but this level was not breached. At one point, only 7 trades were opened, down from the week maximum of 17. Losing positions are less than 10% of equity at the close.

Looking at the heatmap, this is showing a shift in zones to a higher level (1.345 to 1.354) from the previous zone (1.328 to 1.34), with price now resting at the top of the original zone, as per my Wednesday prediction on StockTwits.


The long term view as shown by weekly chart (support lines in Green, Resistance lines in Red) is still negative.

Wednesday, 9 November 2011

Now that really ticks me off (Why testing with tick data can be 99% wrong!)

Dontcha just hate it when you spend the weekend back-testing your latest software, only to get disappointing results when you forward test the next week. Where did I go wrong? How can this be happening?

One often mooted reason is the data used for the back-test. If the data is not representative of the live environment, our test results are not likely to be reflecting anything near reality.

Of course, there is the argument that back-testing is intrinsically useless because the future does not reflect the past. Well, a brazillion (large number) folks would disagree. I include among those any trader that uses a support or resistance point, Fibonacci projection or similar in their strategy. What else do these demonstrate but market memory? I digress ...

The list of problems with data includes:

Difference between demo and live: Even if you recorded tick data yourself from a demo server, it may not reflect what is happening on the same broker's live server. Big and frequent differences point to the need to look for a new broker.

Data not reflecting "market" liquidity provider sentiment: Foreign Exchange is a huge market. Retail brokers only have a (usually small) slice. Their quotes will reflect that small share, plus their own spreads to reflect their trading position (after all the majority are actively trading against you). I don't want to reiterate the list of broker "dirty tricks" in this article. Dump a months worth of M1 data, come back a month later and look at the historic data currently shown. You will often find peaks/troughs disappear. These are artificially jacked quotes designed to knockout trade stop losses.

Data gaps: Wow! look at that hugely profitable renko trade! Unfortunately the untradeable stream of bricks produced by my chart generator were entirely due to the gaps in the data I used.

Data granularity: Using 1 minute closes to test a scalping system may not be the optimal method, especially if your system artificially generates ticks based on the Open, High, Low and Close of that bar. Metatrader, for example, uses a technique called fractal interpolation to generate fake ticks from the summary bar data.

Data obtained from a different broker: It goes without saying that testing with data from a different broker has its problems, results depending entirely on the correlation between them and prices from the target broker.

Applications requiring volume as a key parameter: Some providers dont provide volume at all with their data (e.g. Gain Capital). Some provide bid and ask volume separately (e.g. Dukascopy). It is questionable in many cases whether the volume numbers are representative of anything.

It's all in the percentages

Bwa ha ha ha! Sorry, let me pick myself up from the floor and dust myself off. There is sooooo much BS talked about 99% vs 25% tick data that I have to expose this right away. I refer to the test summary report MT4 produces when doing back-testing. If you use fractal interpolation, the percentage will be low, like 20 to 25%, right? But if you have tested with good quality data, the percentage will be high, like 99%, right? WRONG! The 25% figure is a number that the strategy tester in MT4 writes into the tick data file. The 99% figure is a number that the PROGRAM that generated the data writes into the tick data file. Simple as that. In version 406 of MT4, it is a double value written to  bytes 232 to 239 of the file. Any reprobate could fake the "quality" of data used in their testing using a very simple program.

Warning note: MT4 tick data DOES change sometimes from build to build. Please ensure you are using tick data generated for your build, especially if you purchase it.

Solution

There are several solutions to the issues mentioned above, and whichever you take will depend on the type of testing you want to do, whether you are scalping or working on longer time-frames, using time-based or price-based charts.

Some very nice scripts are freely available for downloading, and given time, one can become very proficient at using them. One problem for me is that they usually run very slowly, very frustrating for me if I want to generate a tick data set for several currencies and time-frames on the fly. Being time-conscious, I had to bite the bullet and spend some time, firstly deciding what approach suited me, and then implementing a system. The beauty of porting to a more modern environment such as VB/Java/C++ allows me, as a programmer, to revisit all of the programmer decisions that must have been made multiple times by the various implementers. e.g. Once you move out of MQL4, you need to implement your own StrToTime function, which is fun! As I mentioned previously, quick access to representative source data is important to me, so using Dukascopy with its wacky interface is largely out of the question. My choice of data provider allows me to download in bulk, on the fly, in a matter of minutes. My new system allows me to quickly convert this into a tick data file with 99% quality (or is it 100%?), (big smile .....). BTW, did I mention it can also generate renko tick data?

Monday, 3 October 2011

Expert Advisor development process

PT1 - The donkey work, formulating the manual strategy.


   The expectation of what a forex robot, or Expert Advisor, will do largely depends on the experience of the individual using it. If you feel that an EA is appropriate to trade your strategy, then you will have a better chance of success. If you have not traded the strategy manually, then you are at best guessing as to the probability of its potential success or failure.

   It is useful to follow the thought process behind a strategy, test it out manually and then see whether or not it would be advantageous to create an automatic system.

   I wrote the following article in order to describe the full development process with the following major steps:

1. Identifying the opportunity
2. Calculating entry and exit points
3. Money management

   The pictures I display were created using indicators that I have developed for my own purposes. Though I am a commercial developer, I explain exactly how the same results can be obtained for free.

Identifying the opportunity

   For the example strategy, I have chosen a simple mean reversion system. In one shape or another, mean reversion forms the basis of the majority of systems seeking to profit from currency moves (and also those systems that profit from prices that stagnate!). So let me first explain in simple terms what mean reversion is:

   There is a tendency for a price series to follow a general trend. Within that general trend, there will be minor trends. The tendency for the price to follow the general trend, whilst exhibiting minor variations, is called mean reversion. More technical/official explanations can be found here and here. Note that the first link (a more mathematical treatise) provides a clue as to how we will formulate our strategy ("regression to the mean").

   If prices regress to the mean price, then, if we measure the distance a price is from its recent mean, we can calculate the potential profit we could achieve if we took a trade right now, and, following our trade entry, the price nicely reverted to its mean price. In order to identify the opportunity, we would need only to look at a currency pair, and see how far, right now, the price is distant from its mean.

   We can calculate the mean (over our chosen time period), and then apply some simple arithmetic. If the price is above the mean this would indicate a possible future tendency for the price to fall. If the price is below the mean, this would indicate a possible future tendency for the price to increase. The distance between the price and the mean shows us the potential profit.

   Although I can't claim to have seen and/or used all the commercially available trading platforms, I would make a (small) bet that all of them have the capability to display moving averages. A simple moving average is suitable for our purposes. Since we are going to be testing this strategy manually, I have chosen to use a daily timeframe, set up the trade, and then come back the next day to see if I need to make any adjustments.

   In the following diagram, I show a recent daily EURUSD chart with a 20 period (one trading month) simple moving average. This is entirely suitable for our purposes and we could stop here and trade the signals so generated as they have been traded since the 1970s (despite it statistically NOT being a causal phenomenon!).

EURUSD1 with SMA(20)
   I think there is a better way; remembering the clue we had before in the mean reversion definition, it is also possible to use a different mechanism for this type of trading. I refer to linear regression. Linear regression is a way of finding the "straightest line between 2 points". Choose the mid of a bar at the beginning of a period, the mid of a bar at the end of a period, draw a line between them and you have roughly what we need (again, for a more in depth perspective, see here and here. Unlike the simple moving average, this can filter out some of the minor moves that occur in the chosen period (i.e. the simple moving average will be irregular, the regression line will be straight - linear). We can see how far off the mean the price moves, allowing us to weigh up exactly which currencies are currently suitable for us to trade. If the regression line slopes upwards (trend for the period is up), and the price is currently below the mean, this provides the setup for a long trade. If the regression line slopes downwards (trend for the period is down), and the price is above the mean, this would indicate the possibility of taking a short position.

   If we add a fixed amount to each side of the regression line and draw two more lines, we can more clearly see what and where the minor trend is, and predict more clearly where it could go next. If we see the price bouncing along a fixed "regression channel", we might conclude that, if the price is just below the upper line, a downwards reversal is imminent. The next picture shows the Metatrader4 built in Linear regression channel indicator. The picture after that shows an adapted channel indicator, which moves out the upper and lower lines so that they just touch the current maximum highs and lows of all the bars in the channel. This allows us to see more clearly which bars defined the limits of the actual channel, rather than the usual regression plus average daily range that MT4 gives us.


EURUSD1 with Linear Regression channel, take profit and stop loss
EURUSD1 with adjusted Linear Regression channel, take profit and stop loss
 Calculating entry and exit points

   An obvious entry point is entry at market when we identify the opportunity. We have a choice of take profit points. We could exit once the price crosses the regression line (reversion to the mean will have completed), exit half the position in anticpation of a further move, or add to our position on a definite cross of the centre line. For illustration purposes, I choose the easier (and nearer point of the regression line). Drawing a horizontal line and noting the price where where the regression line is on the last bar gives us our take profit (TP) point. For stop loss (SL), if the price moves outside the near channel boundary, then we have a breakout of the channel and our directional bet is jeopardised. Other possible SL points are at the high/low of the previous bar, or high/low of a bar at some point in the period where we think we won't get stopped out unnecessarily.We draw another horizontal line and note the price at that point.


Money management

"I spent almost all of my money on women and alcohol, the rest I just wasted - George Best"

   We have all the information we need to make the trade, except how much do we bet? I created a simple blotter (trade list) in Excel, and created a formula for calculating the volume as follows:

=MAX(MIN_LOT,(RiskPC*Balance)/(ABS(OpenPrice-StopLoss)/TickSize*TickValue))

   I use a percentage of my balance, and divide this by the maximum adverse price deviation I will allow, and then divide again by the pip cost. We now have the volume, stop loss, take profit, and can now take the trade.

   I also use this blotter to document my thinking behind each trade, and the result, so I don't make the same stupid mistake twice!

Below are some actual trades. I display the ADX(2) in each one to confirm my understanding of the trend strength.


CHFJPY with LRC (19) to eliminate outlier candle
GBPJPY with LRC(20) and Opportunity Indicator (See part2)
USDCHF with LRC(19) eliminating outlier candle


PT2 - Automating the process.

In PT2, I will be describing how to identify the trading opportunities for every available currency pair, and outlining the EA design.

Saturday, 16 April 2011

Plagiarism, The Sincerest Form of Flattery?

I get some strange requests! Actually, due to the way in which we all think, most requests to ourselves results in some form of counter-questions such as Why? What for?, and in my case How Much (big grin!). Forex, and in particular technical analysis, is a diverse sphere of interest, so big that knowledge of all the techniques and studies is beyond the limit of my memory. Following each customer request therefore comes a period of research/review, call it what you will, so that I can better understand the customer's problem. Now, sometimes there may be a language problem (which i see as my problem since I am not effectively communicating with my client), but generally one party is at a different level of understanding than the other, so I must make amends to get on the same level.

I firmly believe that there are not many original ideas in any subject, and that most innovations are a rehash of a previous work, maybe with a different bent. Only by sharing our original work I believe can we grow at anywhere near an acceptable pace.

Passing this work off as one's own, however, transcends, in my very humble opinion, even straightforward copying. It diminishes the reputation of both the original writer (who gets no credit or reward) and that of the plagiarist, who, once found out, has any credibility as an original artist, destroyed.

Given the availability of modern net-based delivery systems, and also the nature of the media to be copied, it is relatively simple to pass off a previous work as one's own. If ever I am asked to construct a forex robot/indicator/script, my very first course of action is to search the massive archives for something similar which already exists. If such a work exists, I can then inform the client that a free work is available (saving them time and money) or offer them a newly created work of my own device. If a client comes to me with a work which they want changing, I first investigate as thoroughly as possible the existing copyright notices in the current work, if any, and steer clear of anything that looks like its been wrongly obtained or copied.

So whats the point of this article? To show I am a goody two shoes? Nope (though I am - bigger grin). I want folks to use that great free internet firstly to understand what it is they really want, then to ensure no similar free work is available that does exactly what they want. And lastly, if you do find a commercial enterprise selling a work that has been clearly copied from someone else, remind others through whatever mechanism you see fit how they are being ripped off!

Saturday, 19 March 2011

110319 - The Week In Pictures

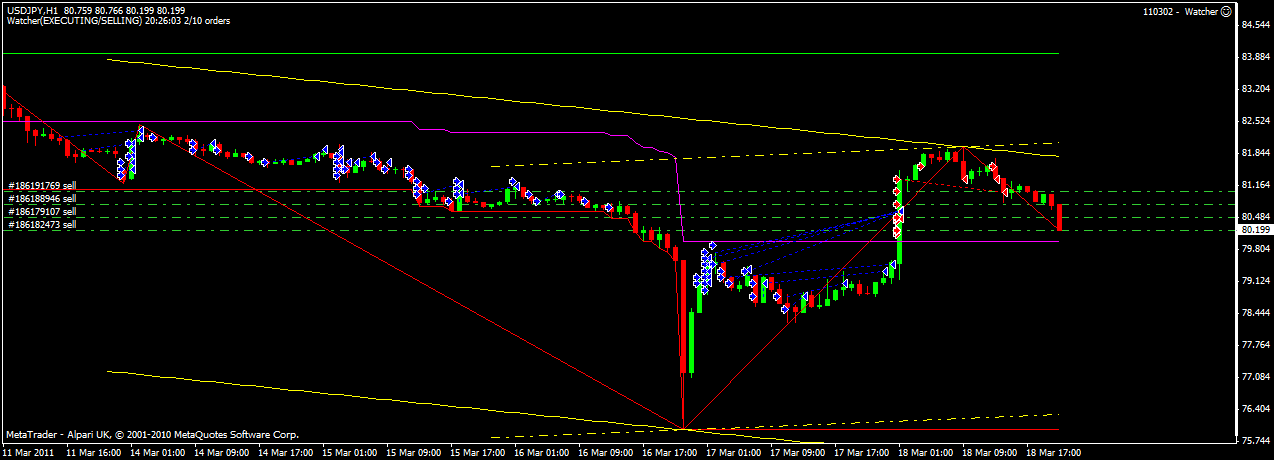
No prizes for guessing the theme of this weeks round-up. Harmonic enthusiasts may even invent new names for the .... (is it a rat/crocodile/peacock/dragon?) pattern which was the result of the frantic buying of yen last week. Luckily, the Watcher circuit breaker prevented a potential disaster, and also allowed a massive US$3K recovery the following few hours. The only other point of interest to me was those pairs that I trade that were NOT correlated (or were inversely correlated) with USDJPY:


Seems the event passed EURGBP right on by ...


USDCAD was inversely correlated.

Saturday, 12 March 2011

110312 - The Week In Pictures (Sendai Tsunami effects)

Continuing strength of CAD and CHF, plus the dramatic events in Japan, were responsible for some interesting happenings this week. It is sometimes easy to take a position, however right or wrong, on the major currency pairs, but the crosses remain a little more inscrutable. Yen for instance, started to fall as soon as the news of the 7 metre high tsunami was broadcast. The market then surprised with a huge rally, which continued for another 8 hours. The initial position is usually negative on bad news, with astute traders knowing that any dip or rally, once overdone, usually retraces. So the question is how do events like this effect, say, AUDJPY, CADJPY or CHFJPY? The fortunes of Australia, being a major trading partner with both Japan and China, are inextricably linked to both number 2 and 3 economies, but what about another commodity currency like CAD, how will that react? Read on ....


AUDCAD showing an initial dip, followed by a strong rally starting at 0700 on the chart (the 8.9 magnitude quake that hit Japan started at 02:46 local time).


AUDCHF exhibiting similar effect, great signals from Swing indicator.


AUDJPY zoomed in to show the multiple take profits executed by Watcher.


AUDUSD chart showing high correlation with AUDCAD.


Tsunami effect on CADCHF shows less of a retracement after an initial fall, indicating the bigger detrimental effect on CAD.


This is backed up by the greater downward swing effect seen here in CADJPY. A 38.2% retracement upwards is then exhibited.


CHFJPY showing an almost, but slightly lower retracement.


USDCAD remains in the doldrums (Google it!) after reaching a new nDay low on Wednesday of 0.9677.


USDCHF similarly bound to the lower end of the allowed grid, after rising significantly off recent lows. For both these latter pairs, the decision has to be made daily as to whether to cut older out of the money trades in order to allow the take profits from new trades to happen. Generally, if there are less than the maximum number of trades, and at least one trade looks like it has a chance of making a profit, then I leave it until the next day. USDCHF has recovered well enough, now I am only watching USDCAD closely each day.

Friday, 4 March 2011

110304 - Thought Control or How (not) To Create A (losing) Winning System

As a systems designer/developer, I am often asked to validate certain client ideas. Leaving aside all judgement of the proposal for a while, I set out first to ensure I thoroughly understand it. Then, using my own experience, I think of all the possible reasons why the hypothesis is flawed. I treat all proposals as mission critical systems, which they are, since our hard-earned cash is at stake.

Should my negative-thinking be proved wrong, or the thoughts inconclusive, I then set up some experiments to assess the validity of the idea.

For automated trading, here be dragons. We code up a rudimentary prototype, with all the features hypothesized to give the design a successful outcome. We back-test, optimize, and then look at the results. If we can manage a decent-looking equity curve, our hypothesis is confirmed!

Or is it? Did we use typical data? Is our optimization (in terms of operating parameters) valid? Did we stumble across the one golden trade to the exclusion of others which gave us a huge balance? Did we need to make 1000 trades in order to get $100 profit? Was the account draw-down exhibited in our test results enough to make us think again? The fact is that the test results rely on the characteristics of the test data. If it is unfeasible that those characteristics will re-occur, then it is unlikely we will achieve the same profit.

Unfortunately, most of our critical thinking in this respect is clouded by what psychologists call Confirmation Bias. This, put simply, is our desire to believe arguments which reinforce our own. Instead of asking questions, or carrying out experiments, which would disprove our hypothesis, we seek out only those that reinforce it.

On the other hand, listening to opposing views and not dismissing unpalatable evidence may be the key to finding what we are looking for. By rejecting the negatives for a sound reason other than they don't confirm our own beliefs, we may be on the right path. By using the negatives to change our own thinking, we may save ourselves time and financial loss.

I love to read through the forums, and read them in the same style that I read my email, newest to oldest unread. In that way, I get the most recent, hottest information first, which allows me to take into context the (time) prior data, and evaluate it in another way. We have nearly 10 years of forum data online, and an amazing wealth of knowledge on tap, in terms of what real developers thought, how they acted, and what the results were.

I find the process of discovery and idea validation the most exciting aspects of my job, and so also provide consultancy along this line. Even if the client does not accept my proposal, or wishes to choose a more sympathetic vendor, I feel obliged to share with them my process and results. Should my own thinking be contradicted, I can always, at my own expense, revisit the counter-argument and reevaluate my position.

Learn like you will live forever. Live like you will die tomorrow, because one day you will be right ...

Further reading on Confirmation Bias

Saturday, 26 February 2011

110226 - The Week In Pictures

What an interesting week we had! Risk off again with big increases in JPY and CHF, at expense of USD, GBP and EUR. Watcher big account is now just under 200% up since September last year, small account up at 127%. Since both accounts operate without stop loss, its a bit of an art to get the lot sizes correct so that the account does not become over-traded. I think the changes I made in Jan, just after the account doubled, have now paid off and I am beginning to understand what the grid sizes should be for each currency. I am investigating ways of making this more scientific, so that I am not just kidding myself. My biggest problem is that it is so time-consuming to back-test each pair for any considerable period of time on a tick-by-tick basis. So far all attempts at this have been inconclusive. It's still a matter of watching the screen when my price alerts activate, day after day, week after week, month after month.

Following are some screen-shots of the more interesting pairs:
EURUSD is caught in the risk-on, risk-off mentality of the market. A good pair for grid trading, slots need to be wide and lot sizes small. Count the many take-profits this week!


GBPCHF again showing some violent moves, crossing the nDay midpoint steeply from above and continuing to provide new buying opportunities.

From the length of the red dashed lines in this chart of GBPJPY, you can see that some of the trades now completing have been around for a while. In fact, some of these go as far back as January. The slow blade pierces the shield!

Whenever USDCAD reaches or breaches the nDay low-point, its time for a manual trade. These are always the same size and, once executed, become just another grid trade. I am now waiting for the Swing indicator to turn upwards, and be confirmed by the Smoothed RSI Inverse Fisher indicator, before going long(er). I actually missed the touch of the low-point on 21st, which I was a bit miffed about.

Player of the week award has to go to USDCHF, breaching its lifetime low and continuing downwards. I was ready to buy-in at 93c (plus a tad in case it didn't breach) and was a bit gob-smacked to see how far it went down. I managed to buy in again at the right point, and ended up late Friday with +30 pips. My original trade was up about +12 pips, so I decided to go to sleep and let it ride. Bit disappointed to wake up at 6am this morning to find it about the same number of pips underwater. You can see it almost reached my TP (the dashed lime green line) but there's no prize for that!

Tuesday, 22 February 2011

110222 - Cloaking Devices and Photon Torpedoes ....

We often forget that there is a counterparty to every trade that we make. Exchange trading shields us from the risk we would otherwise have if the opposite side were to reneg on the contract, or otherwise be unable to fulfill it. Where there is no exchange involved, as in retail FX, our counterparty is usually our broker. Since all is (un)fair in taxation and war, often, like any other adversarial situation, the party with the most information, and therefore the most power, has the advantage.

When coding, I seek every advantage against my opponents, those elusive bugs, by having the highest level of compiler warning possible, following strict style guidelines and well-proven design techniques.

Why should we therefore give away any information to our adversaries when trading? We often forget that the other side has the power to, for example, momentarily jack prices (stop hunting) and to delay orders until a more favourable quote arrives from the liquidity provider. As we write software to give ourselves the best chance of making money, so our adversaries are also doing the same thing.
 
The counterparty has several vital pieces of information provided to them, by us, in every order that we send. These are price, volume, profit target, and stop loss.

It is difficult to perceive how price and volume can be used against us, or how we could avoid sending that information. However, consider a gridding application which always sends the orders at precisely one grid width with the same volume. Do you think that can be detected and the information extracted and used against us? Sure it can! Randomly varying (slightly) grid slot sizes and volumes (within the account balance boundary, difficult to do with $1000 ...) may give us an advantage, or at least reduce the other side's advantage.

Withholding profit targets and stop loss prices is feasible, and recommended. Stops can only be "hunted", and profit targets avoided, if they are known. Having your software continually monitor orders, and close them according to your own operating parameters, effectively removes more of the other side's weapons. Of course, if you operate over the internet, then you have a problem with disconnections and delays. Failure of your software or hardware (of which your connection mechanism is an integral part) leaves you exposed to unlimited downside if price moves against you. To combat this, you can employ hard, liberal stops, outside of your expected stop. There are of course those situations where your soft stops would not be hit due to price-gapping, but then neither would a server-side stop.

A final note about trade comments. If I were writing defensive software, I would scan all orders for comments. If I saw something like "Andy's Neural Network EA", I would consider it a challenge and consider adapting my software, especially if this EA became prolific and successful. On MT4, you can't comment a manual order. I wonder why?

Saturday, 19 February 2011

110219 - The Week in Pictures

In my last post I talked about Harmonic Patterns. Unless you are a geometry enthusiast, or have a very good eye, using pattern recognition software for these empirical signals is essential. If your software can detect the patterns reasonably quickly and communicate those signals to your encompassing system, you are in for some potentially profitable trades.

AUDUSD showing recent Bullish 5-0 pattern
AUDUSD - A Bullish 5-0 pattern was indicated late last Wednesday. The 3day Linear Regression Channel Indicator shows the whole short-term trend so far. I also expanded the chart to show confirmation of the previous Bearish Gartley pattern detected on 19th January.

EURCHF showing Bearish 5-0 Pattern
EURCHF exhibited a Bearish 5-0 early afternoon of 6th January. This was later confirmed by the Smoothed RSI Inverse Fisher Transform Indicator, and made for a potentially very nice trade.
EURGBP continues sideways move
EURGBP was interesting from a gridding point of view this week. Volatility of this pair has decreased since set up, and the Watcher's grid setting is now probably a little too narrow. Whilst there are several good swings in the price, Watcher only managed to capture one of them, price continually bouncing just below one of the grid lines.
USDCAD bouncing of nDay low point
USDCAD again bounced off its nDay low point this week. As for the last 2 times this has happened, waiting until the open of the first bar following breach of the old low point presented the best opportunity.
USDCHF nearing all-time low

USDCHF again approaching its all-time low of 93c. Look for some good opportunities as it gets closer to this level.